

Archives

Tagged ‘rebate program‘

Muskoka Real Estate Market Update

The heavy weather that the region experienced this winter and the early spring, including the flooding in many parts of the region, is now long forgotten. The early fall has seen some of the best weather of the year, and with the improved conditions, listings and sales have increased, bringing the market to a status quo similar to where it found itself at this time last year. During the first quarter of 2013, both sales and inventory were off by 20 percent. Market conditions improved in the second quarter, with continued improvement throughout the summer months.

At the beginning of October there were 1236 active listings of recreational properties available in the Muskoka-Haliburton multiple listing service. This represents an increase of 4.7 percent compared to the same period last year, and a dramatic improvement compared to the recreational property inventory available at the beginning of July. Available recreational properties increased in all the trading areas in which Chestnut Park’s agents work with buyers and sellers. On the Muskoka Lakes 341 recreational properties were available, an increase of more than 10 percent. On Lake of Bays there are 131 available properties, an increase of 4 percent, and 311 in Haliburton, an increase of almost 5 percent.

With increased inventory and better weather sales have dramatically improved, matching or exceeding sales results for the same period last year. Although sales for the entire cottage region are slightly off, in the Muskoka Lakes, Lake of Bays, and Haliburton, the market’s performance has been encouraging. 651 properties have been reported sold for the entire cottage region, 37 fewer recreational properties than for the same period last year. On the Muskoka Lakes the results have been stronger. 184 properties were reported sold to the beginning of October, 2 more than last year. Lake of Bays was only marginally off last year’s pace, 81 in 2012 and 79 this year. In Halilburton the results were marginally better, 200 sales this year compared to 198 last year. Compared to the slow start of the year, these results are very impressive.

Pricing of recreational properties continues to be a hinderence to sales. The sale of cottages is rarely driven by necessity. Consequently sellers can be more leisurely in selling their cottages, often settling on asking prices the buyers do not perceive as reflecting value. Pricing of cottage properties is more complex than urban markets: location, exposure, grade, acres, water depths and access can all impact value in dramatic ways, making direct comparisons with properties already sold very difficult. But as sellers are not motivated by necessity, buyers most often seen even less motivated. As a result properties that have not been competitively priced will take a considerable amount of time to sell, with, in many cases, numerous price reductions.

Looking forward, beyond to the end of 2013, the market will begin its seasonal deceleration, as happens every year. I anticipate, barring any weather issues or economic issues, that the market’s start will resemble that of 2012, but by year end 2014 should see improved sales results if not any dramatic increase in average sale prices.

Prepared by: Chris Kapches, CEO Chestnut Park Real Estate Limited, Brokerage
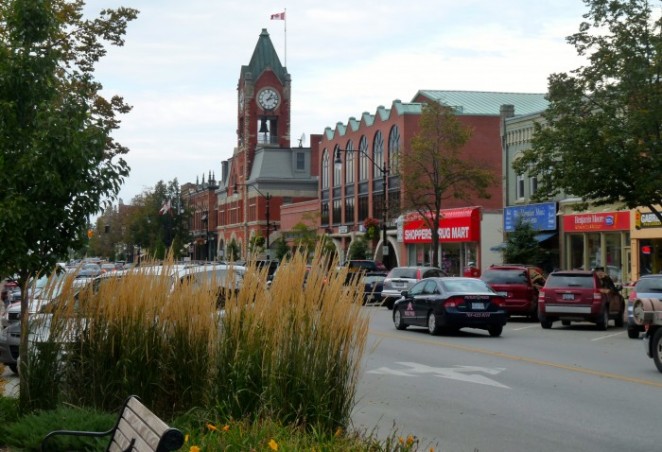
Collingwood Real Estate Market Update

After a brief pause in August which registered steady but not breathtaking sales, the Georgian Triangle real estate market appears to have rallied to the pace-setting groove to which it has apparently become accustomed this season, recording more sales for the month of September than any year since 2005. Some of these sales may have been spurred by the recent increase in fixed term borrowing rates and the prospect of further tightening in the lending regime, prompting some buyers to get off the fence and commit to purchasing. But rather than being a temporary and anomalous blip September’s numbers appear to be part of a broader phenomenon attributable to the Georgian Triangle real estate market being on firm ground and benefitting from the ongoing comparative value, attractiveness and affordability of property available for sale in the area. September’s results therefore build upon this year’s strong performance to date, suggesting that the Georgian Triangle is well positioned to move into the final quarter of 2013 with sustainable growth and healthy sales.


According to the Georgian Triangle Association of REALTORS® (“GTAR”) MLS® Statistic Report for September, 203 properties were sold logging a 28% increase over the 158 sales recorded in September of last year, and 15% more than the 176 sold in September 2011. While the surge in property sales was particularly concentrated in the $100-149,999, $250-349,999 and $600-699,999 ranges the strength of the market was generally felt across the board. In fact sales figures for this September were either better or equal to those for September of last year in every price category but one ($240-249,999). This month’s numbers bring year to date sales to 1644, 8% ahead of last year at this time when 1517 were recorded, and almost 16% ahead of the year previous when there were 1410 sales by the end of September. Total dollar volume for the month increased at an even higher level beating out last year’s performance by 35%, and updated year to date figures to reflect a 10% bump over last year.


New listings were up by 3% with 545 properties coming onto the market in September compared to 529 last year, bringing year to date figures to 5168, 3% behind last year’s total of 5316 at this time. With the disproportionately robust sales pace, however, inventory was down 3.5% from last year with only 2388 active listings recorded at the time that GTAR’s report was created, compared to 2476 last September, and even fewer than the 2501 active listings recorded at this time two years ago.


Not surprisingly, with sales outstripping supply, the average residential sales price year to date is almost 5.5% higher than last year coming in at $332,619 compared to $315,436 last year. The average sale price for single family residential properties for the month of September was $332,830, 3.5% more than the $321,501 average sale price last September. Measured over a twelve month period, the average sale price for this property type is up 6% year over year ($334,529 compared to $315,334) highlighting the steady price increases that have been racked up over the last year.


All in all prospects are good for a healthy fall market. Comparatively speaking, the Georgian Triangle continues to be well placed to weather changing economic conditions, including some variation in the lending environment. Given the tight market and fundamentals which support an optimistic forecast for property sales in the Georgian Triangle as we move into the final quarter of 2013, sellers contemplating putting their properties on the market would be well advised to do so, keeping in mind of course the old adage that pricing should reflect value in the property.


Prepared by Richard Stewart, VP and Legal Counsel Chestnut Park Real Estate Limited, Brokerage
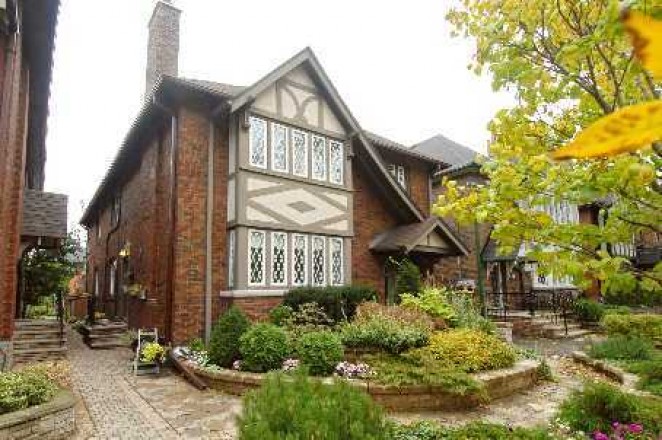
 

Buy or Sell First?

Good question. Unfortunately, like with many good questions, there is no one clear answer. The answer really is: it depends. It depends on your personal preference, the type of home you are selling, the type of home you are buying and the current market conditions.

Option 1) Selling first (preferably with a long closing) and then buying, mitigates the risk of carrying two properties at the same time. But putting your home up for sale before having found your new home can provide uncertainty. What if you cannot find a home you like? If you are looking for an unusual home, this is not practical and you may find yourself leasing in the interim.

However, if you are clear on the type of home, the neighborhood, the price AND you find several places that meet your criteria, then putting your home up for sale first may be your option.

Option 2) Buying first, especially if you are looking for a unique property, can make the most sense. But keep in mind, if you are unable to sell your existing home within the closing period, you may be left carrying the cost of two properties. Bridge financing is available, but the term may be limited.

This option ensures you buy the home you love, but keep in mind, a unique property will be in high demand, so buying conditionally on the sale of your home may not be an option. Are you willing to buy firm (no conditions)?

As you can see, there is merit to both options. You may even find yourself selling first this time and buying first next time. Really…it just depends…

Pricing in Toronto’s Real Estate Market

When preparing to put your home on the market, the goal is (quiet obviously) to get the highest price possible. Perhaps you’ve owned your property for decades, perhaps you’ve invested time and money in improvements like interior updates, additions, or landscaping. Presumably, all the care and attention you have shown your home will be rolled into the cost value in your mind. And while this is all completely reasonable, it is advisable to avoid overpricing your home above all else when putting it up for sale.

Many home sellers reason that they’d like to set the price barrier high and negotiate down from there, but this can be a dangerous move that could cost you some great sale opportunities. Interest in your home will be at its highest when the property is first released on the market (generally within the first week). Home buyers who are serious purchasers will be ready to pounce on new inventory that is well-priced, which could lead to a swift transaction. If the list price of your home is set too high, home buyers and their agents could be discouraged to view it. Later on, as the home sits on the market, you may be required to reduce the price below value in order to drum up new interest.

Remember, the value of your home is determined by what the current market will bear; not what you paid for it originally, or how much you’ve invested in updates. Setting a fair price will attract serious buyers, and if you’re lucky, drum up enough interest for multiple offers.

Courtesy of Chestnut Park Real Estate Limited, Brokerage Blog

What Exactly Do Condo Fees Cover?

With a boom in condominium construction over the past several years, the discussion surrounding new condo owners’ associated fees is a common one. Do these additional monthly fees range from old to new buildings and from neighbourhood to neighbourhood? In short, yes.

Generally calculated based on unit size, your monthly condo fee is your percentage share of the cost it takes to run the building. This includes such things as utilities, window washing, garden maintenance, snow removal, security/concierge, parking, etc. A percentage of this will be allocated to a contingency fund, reserved for unforeseen issues with the building such as roof, heating or plumbing repairs. Your building’s management is, by law, a not-for-profit company and therefore fees collected must cover building maintenance and contingencies, and not a penny more.

In certain buildings, utilities can be controlled and calculated on a per unit basis, in this case, condo fees cover common maintenance only. Your building’s amenities package also contributes to your monthly cost and fees will vary based on whether you have access to things like a gym, pool, rooftop patio, 24-hour security, or indoor parking. As you can certainly imagine, a building with a variety of amenities is more costly to run. That being said, new buildings tend to have lower condo fees than older buildings as their recent construction is often much more efficient.

The idea is for fees to remain on par with what it would cost you to own a home of a similar size, price range, and neighbourhood. Toronto condo fees average between $0.50 and $0.70 per square foot. The per square foot total is an important calculation to pay attention to. If you’re comparing two or more buildings when looking to purchase a condo, always ask for a list of services that condo fees cover to aide in your decision.

In some buildings, it is possible to opt-out of certain services (eg. parking), however it’s always good to keep your re-sale value in mind. Even if you don’t require a parking space, it will likely be an attractive feature when the time comes to sell.

Beware of pre-construction condos that offer monthly fees much below $0.50 as there have been reports of builders setting rates low in year one to entice buyers, and then subsequently raising fees significantly in years two, three and four. That said, it is absolutely normal and expected for your building to re-visit the maintenance budget each year and adjust your fees accordingly.

Collingwood Real Estate Market Update May 2013

The performance of the Georgian Triangle real estate market continues to impress, both on a year over year basis as well as in relation to neighbouring and related property markets. May’s statistics released by the Georgian Triangle Association of REALTORS® (“GTAR”) reveal that the remarkably and comparatively strong pace of sales in the area so far this year shows no indication of letting up. As real estate markets across the region and nationally appear to be showing increasing signs of recovery and stabilization, buyer demand and property sales in the Georgian Triangle are well ahead of the game having avoided much of the downturn experienced in other markets.

In fact GTAR recorded 216 properties sold in May which is the highest number of sales in the area for the month of May since 2007 when 242 properties were sold. May’s unit sales performance is 7% ahead of last year when 202 properties changed hands, and brings year to date numbers to 836 which is 3% more than the 810 properties which had sold last year by this time. As indicated these figures are all the more remarkable given the broader context of economic slowdown and the much discussed and commented upon softening of the real estate market. Significantly, the increase in total dollar volume sold is even more impressive with this month’s figures besting those of last May by a whopping 20%, contributing to a 5% annual gain for total dollar volume sales year to date. Not surprisingly, much of the surge in activity in the area occurred in higher end properties with increases experienced in every price range but one from $300,000 and up. This trend suggests increased economic and consumer confidence as well as a generally more bullish buyer in the Georgian Triangle.

Listings, however, are down 5% annually both for the month of May and on a year to date basis. Only 693 new listings came onto the market last month compared to 730 last May, and 701 for the same month the year before that. Tighter supply with only 2961 new listings so far this year compared to 3113 last year at this time means inventory is down as well, with GTAR recording 2402 active listings in the MLS® system at the time of its report compared to 2590 one year ago.

A reduction in supply and a surge in demand usually mean one thing: more competition for property pushing prices up, and GTAR’s statistics appear to support this. The average residential sale price year to date in the Georgian Triangle is $333,849, 7.7% higher than last year at this time when it was calculated to be $310,119. The effect of the tightening market is even more evident when the average sale price for single family residential properties for the month of May is compared to last year. This past month the average sale price for this category of property in the area came in at $341,434 compared to $289,647 in May 2012, a spike of almost 18%. Activity measured over a longer period of time and spread over a larger number and wider variety of transactions, however, tends to be a more accurate reflection of price trends, softening the effects of arbitrary or fortuitous concentrations in activity or other market anomalies. Calculated over a twelve month span compared year over year, price appreciation is a more modest 4% with this May’s average sales price for the previous twelve month period for single family residential properties coming in at $330,886 compared to $317,502 one year ago.

These numbers and this report reflect the genuine and stable demand for Georgian Triangle properties, and the ongoing attractiveness and perception of value of real estate investment opportunities in the area. If current trends continue, however, pressure on inventory could push prices higher, testing affordability somewhat, particularly if financing conditions and costs become more onerous and costly.


Prepared by: Richard Stewart, VP and Legal Counsel Chestnut Park Real Estate Limited, Brokerage


The Importance of Chestnut Park’s Affiliation With Christie’s International Real Estate

Christie’s – the world’s largest fine arts auctioneer founded in 1766 – is the most important high-end international brand in the world today. As Christie’s exclusive affiliate for Toronto, our clients benefit from the world’s most powerful and prestigious organization for national and international marketing of luxury real estate.

This is a unique benefit to you, our clients, with regards to brand, marketing and access to buyers through the referral network. Christie’s International Real Estate includes an extraordinary worldwide network of 25,000 top residential real estate professionals in 41 countries around the world producing $80 billion in annual sales.

We are proud to be the exclusive Christie’s affiliate not only in Toronto but in Caledon, King, Simcoe, Collingwood, Port Hope, Prince Edward County, Muskoka, Lake of Bays, Haliburton, and the Thousand Islands.

catherinedeluce

signature


Catherine Deluce, Broker, President & CEO of Chestnut Park Real Estate Limited, Brokerage


CIRE comparative sales 2013


Toronto Real Estate Market Update May 2013

The month of May produced statistics that continued the string of strong resale activity in the Toronto market place. Notwithstanding that May of this year did not exceed last May’s sales results, in historical terms May 2013 was an outstanding month. May of last year was the pinnacle of the 2012 market. Following May, and especially after the introduction of the more restrictive lending practices by the Federal Minister of Finance, the Toronto real estate market softened, and remained soft for the remainder of 2012.

In May the Toronto Real Estate Board reported 10,182 residential sales. This compares very favourably with the 10,544 properties that were reported sold in May 2012. This represents a mere 3.4 percent decline. As reported in previous up dates the market is not uniform, with some sectors outperforming others.

Up until May, the high end market was lagging, as compared to last year. This May the high end market ($1 million and higher) has made a resurgence. This May 702 properties in this category were reported sold. This compares with 668 that were reported sold in 2012, an increase of 5 percent. At the very high end ($2 million or more) 120 property sales took place, an increase of 20 percent compared to the 100 properties in this category that sold last year. Until this month high end buyers appeared hesitant to enter the market. Their perception of value and the exorbitant and offensive combined land transfer tax no doubt were responsible for the hesitation. It is too early to tell if this resurgence is due to reduced asking prices or pent up demand, or both.

At the other end of the market, the condominium apartment sector continues to underperform, but not nearly as poorly as has been forecast. Last year 1,632 condominium apartments in the City of Toronto sold. This year 1,499 were reported sold, a decline of 8 percent. The decline was more dramatic in the 905 region, with sales down by 16 percent. Despite these declines, averages sale prices remained strong. Average sale prices for condominium apartments in the 416 region increased 1.2 percent to $372,768, and even in the 905 region, where sales were very slow compared to last year, prices moderately increased by 0.9 percent.

The total number of active condominium apartment listings is also not unfolding as forecast. In May in the City of Toronto there were 5,003 active listings. This compares very favourably to the 4,930 that were available in May 2012, an increase of only 1 percent. If the average sale price for all property types continues to rise, condominium apartments, being the least expensive housing form in Toronto, could see a resurgence, particularly if the available listing base stays low.

At the end of May there were 22,677 active listings. This represents a 10.8 percent increase compared to the 20,462 residential resale properties available for sale in 2012. This number of available properties represents 2.8 months of inventory. In May of last year there was only 2.2 months of inventory. Notwithstanding this increase in supply, the available inventory remains historically low, and still in the range of a seller’s market. In the City of Toronto (416 region) the available supply is slightly higher, coming in at 2.9 months of inventory. The eastern trading areas remain the most active with only 2.2 months of inventory with sale prices on average exceeding the asking price, in some districts coming in with a sale to list ratio of 103 percent.

Sales in May continued at a very brisk pace. In the greater Toronto area all properties sold in 23 days. In the City of Toronto sales were achieved even quicker, in 22 days. As has been the case, sales in the eastern districts took place at a blistering pace, taking only 18 days for all properties on average to sell. The condominium apartment market remains the slowest. In the greater Toronto area all sales were achieved in 32 days. The same sector in the City of Toronto was faster, all sales occurring in only 30 days, another sign that the condominium apartment market is healthier than forecast.

It is not surprising that the average sale price continues to rise. Over 10,000 sales on average taking place in only 23 days will put pressure on prices. In May the average sale price for all properties sold came in at $542,174. This is a 5.4 percent increase compared to the average sale price of $514,567 achieved in 2012. Average prices in the City of Toronto continue to rise as well. A typical home in the City (416) now costs $600,791. The most expensive properties in Toronto are detached homes in Toronto’s central districts. The average price for properties in these districts is $1,335,879, and they all sold in only 19 days.

Going forward I anticipate that the market will slightly moderate, but not to the extent that it did in the second half of 2012. Rising inventory levels should ease the pressure on buyers, enabling them to purchase properties other than in competitive situations. Ultimately rising average sale prices will make some of Toronto’s real estate unaffordable, resulting in some moderation of sale prices. This scenario is likely to play out as we head into the last part of 2013. Over the next few months I anticipate a strong market, with month end data showing positive variances compared to the same month last year.


Prepared by: Chris Kapches, Senior Vice President and Legal Counsel Chestnut Park Real Estate Limited, Brokerage
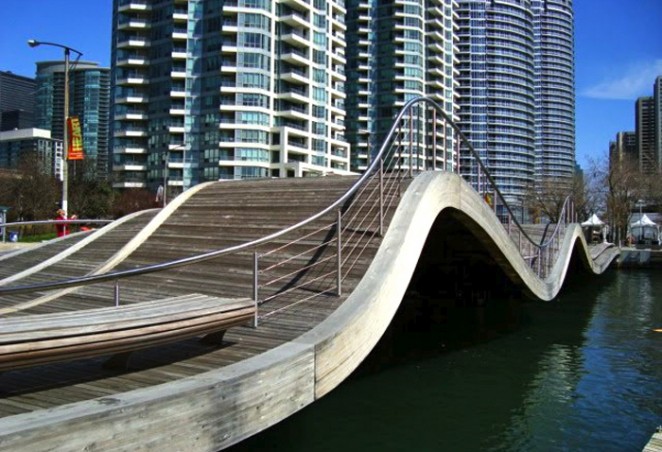
Toronto Real Estate Market Report Spring 2013

There was a pronounced resemblance between the performance of the Toronto residential resale market in February and in March. In February sales were off by 15 percent compared to February of last year, while average sale prices rose moderately by 2.1 percent. Upon deeper review it became obvious that the market was fractured, with some sectors being very active, in some cases frenetic, while others lagged.

We see more of the same in March. March sales were off by 17 percent compared to March of 2012. Notwithstanding this decline in sales, average sale prices for all properties sold in the greater Toronto area rose by 3.8 percent. The Toronto Real Estate Board reported 7,765 properties sold in March. In 2012, 9,385 properties were reported sold. As in February, those properties that were sold were sold in almost record time, at speeds consistent with a strong seller’s market. In February all sales took place in 28 days. In March the pace of sales increased by almost 17 percent to 24 days. The pace of sales is inconsistent with declining sales.

The explanation for this inconsistency is to be found in the performance of the various Toronto market sectors. Properties coming to market with price points ranging from $300,000 to under $1,500,000 sold quickly, and for the most part in excess of the asking prices. For example, it was not uncommon for trading areas in the west and eastern districts of Toronto to report average sale prices (for the entire district) that exceeded the asking price. This phenomenon was less prominent in the central districts where house prices remain the most expensive in Toronto. In the central districts the average sale price for detached houses came in at $1,302,359 while semi-detached homes sold for $771,232, approximately $250,000more than semi-detached homes in the west and eastern trading areas.

The pace and the number of sales in the high end of the market and in the condominium apartment sectors continue to be a drag on the overall market. There were 11 percent few high-end properties ($1 Million or more) sold in March of 2013 compared to the same month last year. It should be noted that is a promising improvement compared to February’s results. In February the high end sector was off by 18 percent. The improvement was more dramatic for properties having sale prices in excess of $2Million. In February that marketplace was off by 27 percent. InMarch, the decline was only 7.6 percent compared to March 2012. In actual numbers, March saw 462 reported sales having a value of $1 Million or more (521 in 2012) and 72 having a value of $2 Million or more (78 in 2012).

The condominium apartment sector continues to lag.Whereas the overall market (including condominium apartments) saw all sales take place in 24 days (on average) in Toronto it took condominium apartments 32 days to sell, 33 percent longer. Central Toronto was slightly more robust with sales taking place in 30 days. Last year sales took place in 28 and 26 days, respectively. By comparison, detached and semi-detached homes in March were selling in less than 24 days and as quickly as 12 days in some trading areas (the eastern districts).

There are two aspects of the condominium apartment market that were encouraging in March. Firstly, average sale prices for condominium apartments actually increased by 2 percent compared to last year to $367,595. Secondly, the market is not being overwhelmed by inventory. In the city of Toronto there were 4,330 condominium apartment listings. This is only 8 percent higher than the number of listings on the market in 2012. In this regard the central districts, where the highest concentration of condominium apartments is to be found, did not fare as well. There condominium apartment inventories increased by 39 percent, from 1956 units for sale in 2012 to 2,733 in March of this year. It was also encouraging to see that in some trading areas sale prices of reported condominium sales were equal to or exceeded the asking price.

Going forward,April will no doubtmirror the performances of February andMarch. Some sectors of themarket will be extraordinarily strong, while condominium apartment sales, and less so high-end property sales, will be a drag on the market. At this time there is nothing in the economic forecast nor is there any likelihood that there will be any changes to the stricter mortgage lending requirements that would cause the market will move to a higher gear.

Prepared by Chris Kapches

Toronto Real Estate Market Update Winter 2012-2013

The Toronto residential resale market provided some intriguing data for the month of February. Looked at as a whole it would appear that it is undergoing a negative shift, the continuation of a trend that started in the second half of 2012 and has continued into this year. On closer inspection we see a fragmented market, with some sectors as robust as the record breaking pace of early 2012, and others clearly lagging, dragging the overall performance of the market into negative variance territory.

In February, 5,759 properties were reported sold. In 2012, 6,809 properties were reported sold by the Toronto Real Estate Board, a decrease of more than 15 per cent. Notwithstanding the decline in sales compared to last year, the average sale price increased, but more moderately than recent months. Last February the average sale price came in at $500,249. This year it increased to $510,580, an increase of 2.1 percent. Increases over the past few months have been in the 5 to 7 percent range.

Interestingly enough, the sales that were recorded took place at a pace normally associated with very robust markets. In February all reported sales took place in 28 days (on average) after they were listed. Any time the average days on market is less than 30 days it reflects a seller’s market, which is ironic in light of the fact that compared to last year, the market was off by more than 15 percent.

Last year, when the market was on pace to smash all previous records for sales, the average days on market was 24 days. A deeper analysis of the market indicates that some sectors and housing types are more robust than others. The high-end, or ‘luxury’ home, market is showing weakness compared to last year. Similarly the condominium apartment market is lagging compared to 2012.

In February 2012, 407 properties having a value of $1 Million or more were reported sold. This year that number declined to 334, a decline of 18 percent. The decline in the very high-end properties, having a value of $2 Million or more, has been even more dramatic. Last year 69 properties in this category were reported sold. That number declined to 50 this year, a decrease of more than 27 percent. This decrease has an obvious impact on the monthly average sale price.

It is difficult to pinpoint why this area of the marketplace is not performing well. One explanation is that buyers can no longer obtain a high ratio mortgage on properties with sale prices in excess of $1 Million. It might also be that the value of high-end properties, particularly with values in excess of $2Million, are no longer supportable. During the robust market between the spring of 2009 and last year, prices of high-end properties were strong. Perhaps they pushed the limits that the market could bear. With a second land transfer tax, purchases in excess of $2 Million become quite onerous. For example the combined provincial and municipal land transfer tax a buyer of a $2.5 Million property pays is an outrageous $92,200.

The other sector that is lagging is the condominium apartment sales. I do not believe, as is often reported in the press, that this is primarily due to an overwhelming increase in inventory. In the Toronto (416) marketplace, sales in February were down by 20 percent. Average sale prices declined by 4.7 percent. On average it took 36 days for a listed condominium apartment to sell, 33 percent longer than all properties in Toronto. Detached and semi-detached homes in Toronto sold very quickly, as low as 15 days in Toronto east end districts to 20 days in Toronto’s central districts. In comparison, condominium apartment sales are at best tepid.

Condominium apartment inventory has not increased dramatically compared to last year. The total number of condominium apartments available for sale in the Greater TorontoArea (416 and 905) was 5,458. Last year there were 5,066, an increase of slightly more than 8 percent. In the city, where the bulk of condominium apartments is to be found, the increase is less dramatic. Last year there were 3,712 available for sale. In February of this year there were 3,785, an increase of a mere 73 additional condominium apartments. Considering that sales are off by 20 percent, inventory levels have actually declined. It may be that we will see inventory levels grow as we proceed through the year, but it has not happened yet.

So the reputed cause for the slow down in condominium apartment sales cannot be attributed to higher inventory levels. Rather it is not doubt due to the restrictive mortgage lending rules that the federal government has implemented. Condominium apartments are usually the first and only choice for first time buyers. In the city of Toronto (416), the average sale price in February was only $352,614. There are reports that indicate that 17 percent fewer buyers qualify under the new stricter lending guidelines. A number that is not inconsistent with the 20 percent decline in the condominium apartment market in 2013.


Prepared by: Chris Kapches, Senior Vice-President and Legal Counsel


February 2013


1300 Yonge Street, Suite 100 Toronto, Ontario M4T 1X3 • P: 416.925.9191 • F: 416.925.3935